Showing posts with label 2016. Show all posts

Tuesday, September 5, 2017

ECU Makes Trek to Morgantown in Week 2

9:08 PM
ECU Makes Trek to Morgantown in Week 2
ECU will open its 2017 road schedule when the Pirates travel to Morgantown Saturday to meet West Virginia at Milan Puskar Stadium. The tilt against the Mountaineers will also represent the second of four non-league games on ECU’s slate, following a 34-14 setback against defending FCS champion James Madison last week and preceding home meetings with Virginia Tech (Sept. 16) and BYU (Oct. 21). The Pirates will also try to improve to 1-1 for the fourth time in the last six seasons and avoid their first 0-2 start since 2011.

Saturday’s meeting against West Virginia will be ECU Head Coach Scottie Montgomery’s first-ever matchup against the Mountaineers - both as a player, assistant coach or head coach. The last time Duke and WVU faced off was in 1985, well before Montgomery’s playing (1996-99) and coaching days (2006-09, 2013-15) with the Blue Devils.

While Dana Holgorsen has never faced the Pirates as a head coach, he did square off against ECU on a combined three occasions as a member of the Texas Tech and Houston staffs. Two of the three meetings were post-season encounters in which the Pirates recorded high-scoring victories: the 2000 Galleryfurniture.com Bowl (Astrodome) and 2009 C-USA Championship Game (Dowdy-Ficklen Stadium).

ECU will try to snap a three-game road opener losing streak when it travels to West Virginia Saturday. After defeating North Carolina 55-31 in 2013, the Pirates followed by falling to South Carolina (2014), Florida (2015) and the Gamecocks again (2016) in successive “away” game lid-lifters. Since 2000, ECU is 4-12 in road openers.

ECU featured 11 first-time starters in its lineup against James Madison Saturday – four on the offensive side of the ball (LT D’Ante Smith, LG Cortez Herrin, RG Austin Lee, RB Derrell Scott), six more on defense (DT Tyree Owens, DE Gaelin Elmore, ILB Ray Tillman, CB Travis Phillips, FS Korrin Wiggins, PIR Tim Irvin) and one on special teams (P Austin Barnes).


Kickoff is set for noon.

Saturday, December 31, 2016

Final FAIR Rankings of the Year Released

11:05 PM
Final FAIR Rankings of the Year Released


The FAIR rankings are based on the following criteria.

Fresh start - All teams in a particular class start the season with identical ratings, or none at all.
All games weighted equally - There is no distinction made between conference and non-conference games, and a week one endowment game counts just as much as a week twelve contest.
Ignore non-NCHSAA games - Because the quality of opponents outside the NCHSAA can vary widely and can be difficult to judge, only NCHSAA games will be counted. Any contests against NCISAA or out-of-state opponents will be treated the same as an open date.
Reproducible - The formulas used should be transparent and simple enough that coaches and members of the media can verify the calculations for a particular team.

Congratulations to Wake Forest, Southern Nash, Shelby, and Wallace-Rose Hill for finishing #1 in their classifications.


Class 4A FAIR Rankings
#1 Wake Forest (11-0) 110.0/11 + 575.00/119 = 14.832
#2 Scotland (10-0) 100.0/10 + 490.00/106 = 14.623
#3 Cape Fear (11-0) 105.0/11 + 596.00/121 = 14.471
#4 Middle Creek (10-0) 99.0/10 + 498.00/111 = 14.386
#5 Charlotte Catholic (8-0) 80.0/8 + 377.00/86 = 14.384
#6 Dudley (10-1) 98.0/11 + 646.00/119 = 14.338
#7 Butler (10-1) 99.0/11 + 575.00/115 = 14.000
#8 Davie (10-1) 97.0/11 + 621.00/120 = 13.993
#9 East Forsyth (10-1) 100.0/11 + 555.50/121 = 13.682
#10 Page (10-1) 99.0/11 + 520.50/121 = 13.302
#11 Garner (10-1) 99.0/11 + 493.50/117 = 13.218
#12 Mallard Creek (6-1) 60.0/7 + 340.00/74 = 13.166
#13 Hillside (8-1) 79.0/9 + 419.00/97 = 13.097
#14 Myers Park (9-1) 89.0/10 + 442.50/107 = 13.036
#15 Lake Norman (11-0) 103.0/11 + 429.00/121 = 12.909
#16 West Johnston (9-1) 87.0/10 + 439.00/109 = 12.728
#17 Vance (8-1) 80.0/9 + 353.00/92 = 12.726
#18 Cardinal Gibbons (10-1) 98.0/11 + 417.50/115 = 12.540
#19 West Forsyth (9-2) 84.0/11 + 523.50/120 = 11.999
#20 Heritage (9-2) 90.0/11 + 457.00/120 = 11.990
#21 Pinecrest (7-2) 68.0/9 + 410.00/97 = 11.782
#22 Seventy-First (9-2) 89.0/11 + 414.00/120 = 11.541
#23 Sanderson (8-3) 80.0/11 + 472.50/119 = 11.243
#24 Mooresville (8-3) 75.0/11 + 484.50/121 = 10.822
#25 Mount Tabor (8-3) 73.0/11 + 473.50/117 = 10.683
#26 A.L. Brown (8-3) 76.0/11 + 413.50/114 = 10.536
#27 Hough (7-4) 70.0/11 + 472.50/114 = 10.508
#28 Richmond (8-3) 78.0/11 + 393.50/117 = 10.454
#29 Southeast Raleigh (8-3) 78.0/11 + 400.00/120 = 10.424
#30 West Mecklenburg (8-3) 80.0/11 + 347.00/112 = 10.371
#31 Glenn (8-3) 75.0/11 + 417.50/119 = 10.327
#32 North Davidson (7-3) 66.0/10 + 396.00/109 = 10.233
#33 New Hanover (7-3) 68.0/10 + 355.50/104 = 10.218
#34 Millbrook (7-4) 70.0/11 + 446.00/120 = 10.080
#35 Conley (8-3) 72.0/11 + 402.00/114 = 10.072
#36 Fuquay-Varina (7-3) 70.0/10 + 339.50/111 = 10.059
#37 South Mecklenburg (6-4) 59.0/10 + 394.50/104 = 9.693
#38 Hoggard (6-4) 57.0/10 + 418.00/105 = 9.681
#39 Southwest Guilford (7-4) 66.0/11 + 439.00/120 = 9.658
#40 Pine Forest (7-4) 69.0/11 + 403.50/120 = 9.635
#41 South View (7-4) 69.0/11 + 403.00/120 = 9.631
#42 Wakefield (6-5) 59.0/11 + 505.50/119 = 9.612
#43 Roberson (8-3) 72.0/11 + 357.00/118 = 9.571
#44 Porter Ridge (7-4) 67.0/11 + 406.00/118 = 9.532
#45 Laney (7-4) 64.0/11 + 416.00/114 = 9.467
#46 Northwest Guilford (7-4) 68.0/11 + 393.00/121 = 9.430
#47 Watauga (8-3) 69.0/11 + 365.00/119 = 9.340
#48 Leesville Road (6-5) 60.0/11 + 445.00/119 = 9.194
#49 Ardrey Kell (6-5) 58.0/11 + 437.00/113 = 9.140
#50 Holly Springs (6-4) 60.0/10 + 336.00/110 = 9.055
#51 Rose (6-4) 57.0/10 + 349.00/105 = 9.024
#52 Southeast Guilford (6-5) 59.0/11 + 438.50/120 = 9.018
#53 Alexander Central (7-4) 63.0/11 + 354.50/121 = 8.657
#54 New Bern (5-5) 47.0/10 + 386.50/101 = 8.527
#55 Parkland (7-4) 58.0/11 + 364.00/116 = 8.411
#56 Person (6-4) 54.0/10 + 303.00/107 = 8.232
#57 Green Hope (5-5) 50.0/10 + 358.00/111 = 8.225
#58 Northern Durham (5-6) 50.0/11 + 421.00/117 = 8.144
#59 Clayton (6-5) 57.0/11 + 312.50/119 = 7.808
#60 Olympic (5-6) 50.0/11 + 356.00/115 = 7.641
#61 Harding (5-6) 50.0/11 + 348.50/115 = 7.576
#62 Ragsdale (4-7) 39.0/11 + 470.00/121 = 7.430
#63 Lumberton (4-7) 39.0/11 + 422.00/118 = 7.122
#64 Grimsley (4-7) 40.0/11 + 411.00/119 = 7.090
#65 East Mecklenburg (5-6) 50.0/11 + 297.00/117 = 7.084
#66 Panther Creek (4-6) 40.0/10 + 319.50/111 = 6.878
#67 Rolesville (4-7) 40.0/11 + 375.00/120 = 6.761
#68 Riverside-Durham (4-7) 38.0/11 + 370.50/116 = 6.649
#69 Rocky River (4-7) 40.0/11 + 336.00/116 = 6.533
#70 Providence (3-7) 30.0/10 + 358.00/103 = 6.476
#71 Reagan (3-8) 28.0/11 + 444.00/120 = 6.245
#72 High Point Central (3-8) 27.0/11 + 432.50/119 = 6.089
#73 McDowell (5-6) 40.0/11 + 279.50/115 = 6.067
#74 Overhills (3-8) 29.0/11 + 397.50/119 = 5.977
#75 Athens Drive (3-6) 30.0/9 + 258.50/101 = 5.893
#76 South Central (4-7) 34.0/11 + 283.50/114 = 5.578
#77 Enloe (3-8) 28.0/11 + 352.50/120 = 5.483
#78 E.E. Smith (3-8) 28.0/11 + 348.00/121 = 5.421
#79 Jack Britt (3-8) 29.0/11 + 328.00/120 = 5.370
#80 Ben L. Smith (3-8) 27.0/11 + 334.50/120 = 5.242
#81 Ashley (3-7) 26.0/10 + 269.00/102 = 5.237
#82 Independence (2-8) 20.0/10 + 327.50/106 = 5.090
#83 Purnell Swett (3-8) 24.0/11 + 322.50/114 = 5.011
#84 North Mecklenburg (3-8) 25.0/11 + 292.50/112 = 4.884
#85 Broughton (2-9) 20.0/11 + 358.00/119 = 4.827
#86 Hoke (2-9) 20.0/11 + 350.00/117 = 4.810
#87 Harnett Central (2-9) 20.0/11 + 355.00/119 = 4.801
#88 Knightdale (2-9) 20.0/11 + 354.00/120 = 4.768
#89 West Charlotte (2-8) 20.0/10 + 277.50/104 = 4.668
#90 Southern Alamance (2-9) 18.0/11 + 348.50/120 = 4.541
#91 East Wake (2-9) 19.0/11 + 289.00/119 = 4.156
#92 South Caldwell (2-9) 18.0/11 + 300.00/120 = 4.136
#93 Hopewell (1-10) 10.0/11 + 328.00/114 = 3.786
#94 Jordan (1-10) 10.0/11 + 327.50/116 = 3.732
#95 R.J. Reynolds (1-10) 6.0/11 + 371.50/120 = 3.641
#96 Apex (1-9) 10.0/10 + 279.50/111 = 3.518
#97 Berry Academy (1-10) 10.0/11 + 291.00/113 = 3.484
#98 East Chapel Hill (1-10) 8.0/11 + 254.50/117 = 2.902
#99 Garinger (0-11) 0.0/11 + 294.00/117 = 2.513
#100 Cary (0-10) 0.0/10 + 248.50/111 = 2.239


Class 3A FAIR Rankings
#1 Southern Nash (11-0) 93.0/11 + 607.00/118 = 13.599
#2 Eastern Guilford (11-0) 101.0/11 + 485.00/119 = 13.257
#3 Havelock (10-0) 91.0/10 + 419.00/105 = 13.090
#4 Orange (11-0) 101.0/11 + 401.50/118 = 12.584
#5 Hibriten (11-0) 97.0/11 + 447.00/120 = 12.543
#6 West Craven (9-0) 83.0/9 + 313.50/96 = 12.488
#7 Rocky Mount (9-2) 80.0/11 + 579.50/117 = 12.226
#8 Lee County (10-1) 91.0/11 + 401.50/119 = 11.647
#9 A.C. Reynolds (9-2) 82.0/11 + 458.00/117 = 11.369
#10 Tuscola (10-1) 84.0/11 + 415.50/119 = 11.128
#11 Robinson (9-2) 80.0/11 + 441.50/121 = 10.921
#12 Pisgah (10-1) 87.0/11 + 357.50/121 = 10.864
#13 Southern Guilford (9-2) 84.0/11 + 365.50/121 = 10.657
#14 Westover (8-3) 73.0/11 + 468.50/119 = 10.573
#15 Southern Lee (8-3) 71.0/11 + 485.50/119 = 10.534
#16 Burns (8-2) 66.0/10 + 430.00/110 = 10.509
#17 Hickory Ridge (9-2) 80.0/11 + 389.50/121 = 10.492
#18 Terry Sanford (8-3) 75.0/11 + 431.50/120 = 10.414
#19 Western Alamance (9-2) 81.0/11 + 359.00/119 = 10.380
#20 Eastern Alamance (9-2) 80.0/11 + 361.50/118 = 10.336
#21 West Brunswick (7-2) 60.0/9 + 340.50/93 = 10.328
#22 Sun Valley (8-3) 69.0/11 + 457.00/113 = 10.317
#23 West Rowan (8-3) 73.0/11 + 432.50/121 = 10.211
#24 South Point (7-3) 61.0/10 + 392.00/106 = 9.798
#25 Cleveland (7-3) 63.0/10 + 408.50/118 = 9.762
#26 South Iredell (8-3) 71.0/11 + 400.00/121 = 9.760
#27 Weddington (7-3) 61.0/10 + 365.00/101 = 9.714
#28 Ledford (8-3) 69.0/11 + 409.00/120 = 9.681
#29 Southern Durham (7-4) 65.0/11 + 422.50/117 = 9.520
#30 Crest (8-3) 68.0/11 + 386.00/118 = 9.453
#31 Forestview (6-3) 52.0/9 + 348.50/95 = 9.446
#32 Triton (8-3) 75.0/11 + 313.50/120 = 9.431
#33 Concord (8-3) 69.0/11 + 374.00/121 = 9.364
#34 Asheboro (8-3) 68.0/11 + 365.50/119 = 9.253
#35 West Carteret (7-4) 59.0/11 + 430.00/114 = 9.136
#36 Kings Mountain (8-3) 67.0/11 + 337.00/118 = 8.947
#37 Erwin (5-3) 46.0/8 + 276.00/87 = 8.922
#38 Patton (7-4) 61.0/11 + 399.50/121 = 8.847
#39 Nash Central (7-4) 60.0/11 + 377.50/119 = 8.627
#40 Jacksonville (7-4) 60.0/11 + 346.00/115 = 8.463
#41 Fike (6-5) 53.0/11 + 425.50/120 = 8.364
#42 Northwood (6-4) 52.0/10 + 339.00/109 = 8.310
#43 Asheville (6-5) 53.0/11 + 365.00/117 = 7.938
#44 Cuthbertson (5-4) 45.0/9 + 254.00/93 = 7.731
#45 Marvin Ridge (5-5) 47.0/10 + 313.00/104 = 7.710
#46 Cedar Ridge (6-5) 53.0/11 + 328.50/119 = 7.579
#47 Freedom (6-5) 53.0/11 + 303.50/121 = 7.326
#48 Union Pines (6-5) 49.0/11 + 325.50/120 = 7.167
#49 South Johnston (5-6) 43.0/11 + 380.00/119 = 7.102
#50 Williams (6-5) 53.0/11 + 266.50/118 = 7.077
#51 Central Cabarrus (5-6) 44.0/11 + 361.50/120 = 7.013
#52 Northern Nash (5-5) 41.0/10 + 302.00/108 = 6.896
#53 Statesville (5-6) 46.0/11 + 319.00/121 = 6.818
#54 Northern Guilford (4-7) 36.0/11 + 360.00/119 = 6.298
#55 Carson (4-7) 35.0/11 + 373.00/121 = 6.264
#56 North Forsyth (5-6) 41.0/11 + 277.00/120 = 6.036
#57 Northern Vance (4-6) 36.0/10 + 251.50/108 = 5.929
#58 East Rowan (4-7) 35.0/11 + 329.00/121 = 5.901
#59 Eastern Wayne (4-6) 35.0/10 + 251.50/105 = 5.895
#60 West Henderson (4-7) 35.0/11 + 323.00/120 = 5.873
#61 Anson (4-6) 31.0/10 + 284.00/103 = 5.857
#62 Northeast Guilford (4-7) 36.0/11 + 300.00/119 = 5.794
#63 Ashbrook (4-6) 36.0/10 + 225.00/106 = 5.723
#64 McMichael (3-7) 27.0/10 + 309.00/109 = 5.535
#65 Topsail (4-7) 33.0/11 + 276.50/115 = 5.404
#66 Hunt (3-8) 25.0/11 + 345.50/118 = 5.201
#67 Western Guilford (3-8) 27.0/11 + 305.00/120 = 4.996
#68 St. Stephens (3-8) 26.0/11 + 309.00/121 = 4.917
#69 Cox Mill (3-8) 27.0/11 + 294.50/121 = 4.888
#70 North Henderson (3-8) 23.0/11 + 327.50/119 = 4.843
#71 West Iredell (3-8) 26.0/11 + 283.00/121 = 4.702
#72 Gray's Creek (2-9) 17.0/11 + 381.50/121 = 4.698
#73 Piedmont (3-8) 24.0/11 + 284.00/113 = 4.695
#74 East Gaston (3-8) 23.0/11 + 291.00/116 = 4.600
#75 Foard (3-8) 25.0/11 + 270.00/121 = 4.504
#76 Corinth-Holders (3-8) 27.0/11 + 222.00/118 = 4.336
#77 Hickory (2-9) 19.0/11 + 310.00/120 = 4.311
#78 Richlands (2-9) 18.0/11 + 303.50/115 = 4.275
#79 North Lincoln (2-9) 18.0/11 + 314.00/120 = 4.253
#80 Northwest Cabarrus (2-9) 18.0/11 + 311.00/121 = 4.207
#81 Aycock (2-8) 15.0/10 + 266.00/106 = 4.009
#82 Western Harnett (2-9) 19.0/11 + 264.50/120 = 3.931
#83 Chapel Hill (2-9) 18.0/11 + 272.50/119 = 3.926
#84 Webb (2-9) 17.0/11 + 258.50/115 = 3.793
#85 Enka (2-9) 15.0/11 + 270.00/113 = 3.753
#86 Southern Wayne (2-8) 17.0/10 + 205.50/104 = 3.676
#87 White Oak (1-9) 9.0/10 + 289.00/106 = 3.626
#88 Rockingham (1-10) 9.0/11 + 305.50/119 = 3.385
#89 South Rowan (1-10) 9.0/11 + 298.50/121 = 3.285
#90 Swansboro (2-8) 12.0/10 + 199.50/103 = 3.137
#91 Southwestern Randolph (1-10) 9.0/11 + 255.00/119 = 2.961
#92 North Gaston (1-10) 6.0/11 + 273.00/116 = 2.899
#93 South Brunswick (1-10) 6.0/11 + 257.50/112 = 2.845
#94 Byrd (0-11) 0.0/11 + 321.50/121 = 2.657
#95 North Buncombe (0-11) 0.0/11 + 306.50/117 = 2.620
#96 Smithfield-Selma (0-11) 0.0/11 + 303.00/118 = 2.568
#97 East Henderson (0-11) 0.0/11 + 306.50/120 = 2.554
#98 Morehead (0-10) 0.0/10 + 272.00/109 = 2.495
#99 North Iredell (0-11) 0.0/11 + 301.00/121 = 2.488
#100 Central Davidson (0-11) 0.0/11 + 258.00/119 = 2.168


Class 2A FAIR Rankings
#1 Shelby (11-0) 94.0/11 + 531.00/119 = 13.008
#2 Clinton (11-0) 83.0/11 + 460.00/120 = 11.379
#3 Reidsville (11-0) 94.0/11 + 320.00/117 = 11.280
#4 Monroe (9-1) 76.0/10 + 372.50/102 = 11.252
#5 Bunn (10-1) 79.0/11 + 437.50/115 = 10.986
#6 West Caldwell (8-2) 66.0/10 + 449.50/108 = 10.762
#7 Northeastern (9-1) 70.0/10 + 376.00/102 = 10.686
#8 Lincolnton (10-1) 84.0/11 + 356.00/117 = 10.679
#9 East Duplin (10-1) 80.0/11 + 379.00/115 = 10.568
#10 North Rowan (9-2) 75.0/11 + 438.00/120 = 10.468
#11 East Lincoln (8-2) 66.0/10 + 398.00/106 = 10.355
#12 Surry Central (10-1) 74.0/11 + 402.00/121 = 10.050
#13 Mountain Heritage (9-1) 69.0/10 + 291.50/101 = 9.786
#14 Maiden (8-3) 68.0/11 + 415.50/118 = 9.703
#15 Northside-Jacksonville (8-3) 65.0/11 + 440.00/116 = 9.702
#16 Hunter Huss (8-3) 70.0/11 + 379.50/114 = 9.693
#17 Holmes (8-2) 60.0/10 + 365.00/102 = 9.578
#18 Roanoke Rapids (9-1) 66.0/10 + 306.50/105 = 9.519
#19 Brevard (9-2) 73.0/11 + 327.50/116 = 9.460
#20 Ayden-Grifton (8-3) 62.0/11 + 379.00/116 = 8.904
#21 Hertford (8-3) 64.0/11 + 342.50/112 = 8.876
#22 Hendersonville (8-3) 65.0/11 + 329.50/113 = 8.825
#23 High Point Andrews (7-3) 58.0/10 + 329.50/109 = 8.823
#24 Greene Central (8-3) 68.0/11 + 300.00/118 = 8.724
#25 Randleman (7-3) 57.0/10 + 318.00/108 = 8.644
#26 Wilkes Central (9-2) 66.0/11 + 316.50/120 = 8.638
#27 East Davidson (8-3) 66.0/11 + 313.00/119 = 8.630
#28 South Columbus (8-2) 56.0/10 + 291.00/102 = 8.453
#29 Eastern Randolph (8-3) 64.0/11 + 307.50/118 = 8.424
#30 North Brunswick (6-3) 49.0/9 + 280.50/95 = 8.397
#31 South Granville (7-4) 57.0/11 + 325.50/115 = 8.012
#32 Smoky Mountain (7-4) 54.0/11 + 334.00/113 = 7.865
#33 East Bladen (7-4) 48.0/11 + 391.50/120 = 7.626
#34 Stuart Cramer (7-4) 56.0/11 + 290.00/116 = 7.591
#35 Mount Pleasant (6-5) 50.0/11 + 324.50/117 = 7.319
#36 Franklin (6-5) 47.0/11 + 340.00/114 = 7.255
#37 North Lenoir (5-5) 41.0/10 + 339.50/108 = 7.244
#38 Fairmont (7-3) 49.0/10 + 238.50/103 = 7.216
#39 West Wilkes (8-3) 53.0/11 + 277.50/116 = 7.210
#40 Southwest Onslow (6-5) 48.0/11 + 317.00/116 = 7.096
#41 Beddingfield (6-5) 49.0/11 + 314.00/121 = 7.050
#42 North Johnston (7-4) 51.0/11 + 289.00/120 = 7.045
#43 Franklinton (6-5) 43.0/11 + 355.50/114 = 7.028
#44 West Stanly (7-4) 50.0/11 + 272.00/116 = 6.890
#45 Carver (5-6) 41.0/11 + 373.50/121 = 6.814
#46 Farmville Central (6-5) 46.0/11 + 309.00/118 = 6.800
#47 Parkwood (5-5) 40.0/10 + 268.00/103 = 6.602
#48 North Wilkes (7-4) 50.0/11 + 239.50/117 = 6.592
#49 Southwest Edgecombe (5-6) 40.0/11 + 345.50/117 = 6.589
#50 West Stokes (6-5) 46.0/11 + 284.00/121 = 6.529
#51 Newton-Conover (5-5) 40.0/10 + 269.00/107 = 6.514
#52 R-S Central (5-6) 40.0/11 + 339.50/119 = 6.489
#53 Kinston (6-5) 50.0/11 + 229.00/118 = 6.486
#54 First Flight (5-4) 36.0/9 + 227.00/94 = 6.415
#55 Croatan (5-6) 41.0/11 + 303.50/114 = 6.390
#56 Lexington (5-5) 42.0/10 + 219.50/108 = 6.232
#57 Graham (5-5) 41.0/10 + 218.50/110 = 6.086
#58 Bertie (5-6) 36.0/11 + 312.00/113 = 6.034
#59 Thomasville (5-6) 36.0/11 + 325.50/118 = 6.031
#60 Polk (5-5) 39.0/10 + 222.50/106 = 5.999
#61 West Lincoln (5-6) 40.0/11 + 272.50/118 = 5.946
#62 Madison (5-6) 37.0/11 + 284.00/114 = 5.855
#63 Pasquotank (5-5) 34.0/10 + 249.00/103 = 5.817
#64 Warren (5-5) 35.0/10 + 240.00/104 = 5.808
#65 North Surry (5-6) 36.0/11 + 253.50/120 = 5.385
#66 East Rutherford (4-7) 34.0/11 + 273.50/120 = 5.370
#67 Bartlett Yancey (5-6) 41.0/11 + 188.50/116 = 5.352
#68 Providence Grove (4-7) 33.0/11 + 277.00/119 = 5.328
#69 St. Pauls (6-5) 43.0/11 + 160.00/114 = 5.313
#70 Midway (5-6) 32.0/11 + 281.00/120 = 5.251
#71 Trinity (4-7) 30.0/11 + 295.00/117 = 5.249
#72 Chase (4-7) 28.0/11 + 300.00/119 = 5.066
#73 Washington (3-8) 24.0/11 + 333.50/116 = 5.057
#74 Ashe (4-7) 26.0/11 + 301.00/120 = 4.872
#75 Salisbury (3-8) 25.0/11 + 309.00/120 = 4.848
#76 Red Springs (4-5) 24.0/9 + 203.00/94 = 4.826
#77 South Lenoir (4-7) 29.0/11 + 259.00/119 = 4.813
#78 Forbush (5-6) 35.0/11 + 193.50/121 = 4.781
#79 Bandys (3-8) 27.0/11 + 274.00/118 = 4.777
#80 Lake Norman Charter (4-6) 27.0/10 + 205.00/103 = 4.690
#81 Wheatmore (3-8) 25.0/11 + 280.50/118 = 4.650
#82 Jordan-Matthews (3-8) 24.0/11 + 283.00/118 = 4.580
#83 East Burke (2-9) 16.0/11 + 337.00/120 = 4.263
#84 Draughn (2-9) 16.0/11 + 320.50/120 = 4.125
#85 Dixon (2-8) 15.0/10 + 257.00/106 = 3.925
#86 West Davidson (3-8) 23.0/11 + 219.00/120 = 3.916
#87 Currituck (2-8) 12.0/10 + 240.50/103 = 3.535
#88 Owen (1-9) 9.0/10 + 269.50/106 = 3.442
#89 Carrboro (2-9) 16.0/11 + 232.50/117 = 3.442
#90 West Bladen (2-9) 12.0/11 + 235.00/119 = 3.066
#91 South Stokes (2-9) 12.0/11 + 232.00/119 = 3.040
#92 Bunker Hill (1-10) 8.0/11 + 269.50/118 = 3.011
#93 Forest Hills (1-9) 8.0/10 + 226.00/103 = 2.994
#94 Goldsboro (1-10) 9.0/11 + 234.00/116 = 2.835
#95 North Pitt (1-10) 6.0/11 + 271.00/120 = 2.804
#96 Cummings (0-11) 0.0/11 + 308.00/119 = 2.588
#97 Central Academy (1-9) 6.0/10 + 163.00/95 = 2.316
#98 Southern Vance (0-9) 0.0/9 + 221.50/96 = 2.307


Class 1A FAIR Rankings
#1 Wallace-Rose Hill (10-1) 74.0/11 + 453.00/119 = 10.534
#2 Mitchell (10-1) 77.0/11 + 323.50/110 = 9.941
#3 Tarboro (9-1) 63.0/10 + 359.50/103 = 9.790
#4 East Montgomery (10-0) 67.0/10 + 311.00/108 = 9.580
#5 West Montgomery (10-0) 66.0/10 + 275.00/108 = 9.146
#6 Mount Airy (10-1) 66.0/11 + 261.50/116 = 8.254
#7 East Carteret (9-1) 58.0/10 + 254.50/105 = 8.224
#8 Murphy (7-1) 44.0/8 + 178.50/71 = 8.014
#9 North Edgecombe (8-1) 50.0/9 + 200.50/94 = 7.689
#10 Union (7-4) 46.0/11 + 390.50/120 = 7.436
#11 East Wilkes (8-3) 56.0/11 + 257.50/119 = 7.255
#12 Riverside-Martin (8-3) 48.0/11 + 309.50/110 = 7.177
#13 Thomas Jefferson (5-1) 32.0/6 + 105.00/59 = 7.113
#14 Trask (7-4) 47.0/11 + 324.00/118 = 7.018
#15 Plymouth (6-3) 38.0/9 + 259.00/95 = 6.949
#16 East Surry (8-3) 52.0/11 + 253.50/116 = 6.913
#17 Bessemer City (8-3) 54.0/11 + 173.00/103 = 6.589
#18 Lakewood (8-3) 50.0/11 + 201.00/115 = 6.293
#19 North Stanly (7-4) 44.0/11 + 258.00/117 = 6.205
#20 Gates County (6-4) 38.0/10 + 215.00/98 = 5.994
#21 Northside-Pinetown (7-4) 42.0/11 + 243.00/113 = 5.969
#22 Louisburg (6-4) 41.0/10 + 192.00/104 = 5.946
#23 North Moore (7-4) 44.0/11 + 214.00/110 = 5.945
#24 Southside (7-4) 44.0/11 + 219.00/115 = 5.904
#25 Walkertown (6-5) 39.0/11 + 272.00/116 = 5.890
#26 North Duplin (7-4) 42.0/11 + 227.50/118 = 5.746
#27 Whiteville (6-5) 42.0/11 + 200.50/110 = 5.641
#28 Pine Lake Prep (5-3) 30.0/8 + 135.50/74 = 5.581
#29 Princeton (6-5) 36.0/11 + 249.00/111 = 5.516
#30 Granville Central (5-5) 33.0/10 + 227.50/105 = 5.467
#31 Swain (5-5) 30.0/10 + 208.00/91 = 5.286
#32 Mountain Island (3-2) 20.0/5 + 54.00/48 = 5.125
#33 Cherokee (4-4) 24.0/8 + 138.50/71 = 4.951
#34 Northampton (5-6) 30.0/11 + 240.50/109 = 4.934
#35 Jones (5-6) 32.0/11 + 235.50/117 = 4.922
#36 Southeast Halifax (6-5) 36.0/11 + 174.50/108 = 4.888
#37 James Kenan (4-6) 27.0/10 + 222.00/106 = 4.794
#38 Perquimans (5-5) 30.0/10 + 172.00/96 = 4.792
#39 Camden (5-6) 30.0/11 + 214.00/104 = 4.785
#40 Pender (4-7) 31.0/11 + 230.50/121 = 4.723
#41 Manteo (5-6) 30.0/11 + 192.00/106 = 4.539
#42 Avery (2-7) 16.0/9 + 257.00/96 = 4.455
#43 South Stanly (4-7) 24.0/11 + 261.00/116 = 4.432
#44 KIPP Pride (5-5) 30.0/10 + 123.50/94 = 4.314
#45 Winston-Salem Prep (3-5) 18.0/8 + 171.00/86 = 4.238
#46 Alleghany (4-6) 26.0/10 + 167.50/109 = 4.137
#47 Robbinsville (3-4) 18.0/7 + 94.00/61 = 4.112
#48 Union Academy (4-7) 26.0/11 + 189.00/114 = 4.022
#49 Rocky Mount Prep (2-5) 12.0/7 + 124.50/67 = 3.572
#50 Chatham Central (3-6) 18.0/9 + 139.50/90 = 3.550
#51 Bishop McGuinness (4-7) 24.0/11 + 133.50/106 = 3.441
#52 Spring Creek (3-7) 18.0/10 + 169.00/107 = 3.379
#53 Rosewood (3-8) 20.0/11 + 170.50/117 = 3.275
#54 Mattamuskeet (2-5) 12.0/7 + 115.00/74 = 3.268
#55 Starmount (2-9) 12.0/11 + 259.00/120 = 3.249
#56 Cherryville (3-8) 18.0/11 + 171.00/110 = 3.191
#57 Columbia (3-8) 18.0/11 + 104.00/83 = 2.889
#58 Hayesville (2-5) 12.0/7 + 68.50/61 = 2.837
#59 Andrews (1-7) 6.0/8 + 139.00/71 = 2.708
#60 South Robeson (2-8) 12.0/10 + 151.50/104 = 2.657
#61 South Creek (1-9) 6.0/10 + 207.50/102 = 2.634
#62 East Columbus (1-9) 6.0/10 + 208.00/104 = 2.600
#63 Atkins (1-9) 6.0/10 + 211.00/106 = 2.591
#64 Albemarle (1-10) 6.0/11 + 228.00/117 = 2.494
#65 Weldon (1-8) 6.0/9 + 160.50/92 = 2.411
#66 Pamlico (1-8) 6.0/9 + 168.50/97 = 2.404
#67 Creswell (1-6) 6.0/7 + 103.00/75 = 2.230
#68 Hobbton (1-9) 6.0/10 + 168.50/105 = 2.205
#69 South Davidson (1-10) 6.0/11 + 174.00/113 = 2.085
#70 Elkin (0-11) 0.0/11 + 250.00/120 = 2.083
#71 Comm Sch of Davidson (1-8) 6.0/9 + 115.00/83 = 2.052
#72 Rosman (0-9) 0.0/9 + 156.50/80 = 1.956
#73 Northwest Halifax (0-11) 0.0/11 + 203.00/113 = 1.796
#74 Highland Tech (0-10) 0.0/10 + 143.50/91 = 1.577
#75 Lejeune (0-11) 0.0/11 + 177.50/116 = 1.530
#76 North Stokes (0-10) 0.0/10 + 152.50/105 = 1.452
#77 Kestrel Heights (0-4) 0.0/4 + 58.00/40 = 1.450
#78 West Columbus (0-10) 0.0/10 + 148.50/104 = 1.428
#79 Cape Hatteras (0-2) 0.0/2 + 18.00/22 = 0.818


Saturday, December 17, 2016

Reidsville Wins Their Sixteenth Title Convincingly, 58-12 over Edenton Holmes​

10:37 PM
Reidsville Wins Their Sixteenth Title Convincingly, 58-12 over Edenton Holmes​
WINSTON-SALEM, N.C. – The Reidsville Rams captured the school’s 16th state championship to go along with three regional titles they won in the 1960’s when play didn’t culminate in a full state champion as they blew past John A. Holmes 58-12. Jaron Letterlough accounted for five touchdowns, four rushing and one receiving on his way to M.V.P. honors in the game.

Letterlough opened the scoring with a five yard run in the first quarter, then adding an 18-yard TD to put the Rams up 14-0 early. The Aces struck back with Keimon Bailey streaking for 55 yards and a score, but the point after failed and Holmes trailed 14-6.

Letterlough added a 45-yard touchdown reception and the Rams tacked on a pair of field goals in the second quarter while the Aces got a 7-yard touchdown run by Mitjanta Stanley to make the halftime score 27-12.

The second half was all Reidsville as Letterlough added an 18-yard touchdown run in the third to stretch the Rams lead to 34-12. He added another five-yard touchdown run to take the lead to 44-12 and cement his spot as the game’s M.V.P.

Letterlough was credited with 153 yards rushing on 15 carries, scoring four times on the ground. He added three catches for 47 yards and a receiving touchdown as well.

Reidsville’s Most Outstanding Offensive Performer award went to the kicker Brad Green who was 7 for 7 on the night for point after attempts and converted field goals from 21, 25 and 34 yards. The Rams' Most Outstanding Defensive Performer was Jaquan Hairson with two second half tackles and a fumble recovery in the second half. He added a sack and a forced fumble in the first half.

Reidsville Quarterback Tanner Wilson was steady all night completing 10 of 16 passes for 108 yards and a score.

The Aces finished the season 13-3 as the tri-champions of the Northeastern Coastal 2A Conference. They made their first appearance in an NCHSAA State Championship in the modern era (since 1972). Holmes was paced offensively by Bailey who had 14 carries for 81 yards and a score. He was the Aces Most Outstanding Offensive Performer. Zakeem Brooks was tapped as the Aces Most Outstanding Defensive Performer with seven tackles on the night to lead the team.

Reidsville completed a perfect 16-0 season, winning the Mid-State 2A conference and the program’s record-holding 16th championship. The Rams returned to the State Championship for the first time since winning the 2AA title over Newton-Conover in 2009.


Story courtesy of the NCHSAA

Shelby Claims Fourth Straight Football Championship with a 28-6 Win over Northside-Jacksonville

4:08 PM
Shelby Claims Fourth Straight Football Championship with a 28-6 Win over Northside-Jacksonville
RALEIGH, N.C. – The Golden Lions of Shelby had lived up to the “Golden” moniker all season long as the Lions had never trailed at any point of the 2016 football season coming into the school’s fourth straight appearance in the state championship game. They never trailed in the 2AA title game either, as Shelby took down Northside-Jacksonville 28-6 to win the school’s ninth state title all-time and their fourth straight.

Shelby opened the scoring just 48 seconds into the contest as Devin Gullatte score the first of his two touchdowns on the day from three yards out. The Lions tacked on another score as quarterback Malik Sarratt improvised to find Juwan Sims in the flats before Sims powered his way into the endzone to give Shelby a 14-0 with 7:13 to go in the first quarter.

Sims was named the game’s Most Valuable Player as he caught two passes for 19 yards and a score while rushing for 152 yards on 21 carries. Sarratt was picked as Shelby’s Most Outstanding Offensive Performer completing 10 of 9 passes for 134 yards and 2 touchdowns while rushing for 24 yards. Dax Hollifield was chosen as the Most Outstanding Defensive player for the Lions with 16 total tackles on the day, 3.5 for a loss, a single sack and fumble recovery.

Shelby’s stud receiver Jayden Borders got free to haul in a 7 yard pass from Sarratt late in the second quarter, giving the Lions a 21-0 halftime lead. Borders finished the day with five catches for 86 yards and a score.
Northside-Jacksonville came out in the second half and continued to fight even down by 21. Jonte McMullen found Cameron Rogers who made a beautiful one-handed catch in stride down the sideline for a 33-yard score. The point after was blocked and the Lions held a 21-6 advantage with 7:10 to go in the third quarter.

Gullatte’s second touchdown of the day ended the scoring with a two-yard run with 11:09 to play in the game making the score 28-6.

Northside-Jacksonville completed the season 12-4, finishing second in the East Central 2A Conference behind East Duplin, a team they defeated in the regional finals. The Monarchs made the school’s first appearance in an NCHSAA Football State Championship game.

Shelby finished the season 16-0, champions of the South Mountain Athletic 2A/3A Conference. The senior class completed the rare sweep as members of the senior class were a part of the State Championship team in all four years of their time at Shelby. They became the fourth school in history to win four straight football state championships.

Story courtesy of the NCHSAA

Saturday, November 12, 2016

2016 NCHSAA Football Playoffs

4:00 PM
2016 NCHSAA Football Playoffs
1st Round: November 18, 2016
2nd Round: November 25, 2016
3rd Round: December 2, 2016
Regional Finals: December 9, 2016
State Championships: December 16-17, 2016

Championship Venues
Kenan Stadium (UNC, Chapel Hill)
Carter-Finley Stadium (NC State, Raleigh)
BB&T Field (Wake Forest, Winston-Salem)


2016 Football Championships 1A


2016 Football Championships 1AA


2016 Football Championships 2A


2016 Football Championships 2AA


2016 Football Championships 3A


2016 Football Championships 3AA


2016 Football Championships 4A


2016 Football Championships 4AA

2016 NCHSAA Playoff Pairings

2:47 PM
2016 NCHSAA Playoff Pairings

From 2016-17 NCHSAA Handbook
4.1.17 Playoff Berths/Qualification:
(a) All teams that finish first (1st) in the conference regular season or are the conference tournament champions, automatically qualify. In a split conference a team must finish 1st in their part of the split or be the conference tournament champion to automatically qualify.
(1) Split conferences cannot have separate tournaments, and the regular season conference champion must participate in the conference tournament.
(b) All other teams qualify based upon the best 22-game record (10-game, Football; All games, Tennis, Wrestling and Lacrosse) from the non-automatic qualifiers in a classification.
(c) All classifications will field a full complement of 64 teams with the exception of Tennis, Wrestling and Lacrosse.
(d) If ties exist for the final at-large berth(s) qualifiers, they will be broken by:
(1) All Head-to-Head Competition:
(i) The non-conference game(s) that are dropped for seeding purposes may still be used in breaking a tie
(2) Conference Winning Percentage 
(3) Draw
4.1.18 Seeding:
(a) Once the qualifying teams are determined, they will be divided into four (4) groups, (i.e. East, Mideast, Midwest, West) based upon the longitude of each school.
(b) Seed all first place, regular season conference champions by 22-game winning percentage (10-game, football; All games, Tennis, Wrestling & Lacrosse) followed by;
(c) Conference tournament champions by 22-game winning percentage (10-game, football; All games, Tennis, Wrestling & Lacrosse), followed by;
(d) All other qualifying teams by 22-game winning percentage (10-game, football; All games, Tennis, Wrestling & Lacrosse)
(1) All ties for seeding in (a), (b) or (c) will be broken by:
(i) All Head-to-Head Competition Note: The non-conference game(s) that are dropped for seeding purposes may still be used in breaking a tie. Note: All teams involved in the tie must have played each other.
(ii) 24-game record (11-game, Football; All games, Tennis, Wrestling and Lacrosse)
(iii) MaxPreps Ranking (last available ranking at the time of the seeding) (iv) Draw
4.1.19 Bracketing:
(a) Once the seeding process is complete, the pairings will be made with teams from the East paired with teams from the Mideast and teams from the Midwest paired with teams from the West.
(b) A bracketing template for each sport will be posted on the NCHSAA website.
4.1.20 Reporting Playoff Advancement:
(a) After schools have qualified for the playoffs, it is their responsibility to report advancement by the appropriate method and deadline as designated by the NCHSAA.
(b) Failure to report a playoff advancement will result in a $400 fine to the school. Teams must report advancement no later than 6 a.m. the day following each win.
(c) Postponements should also be reported.


4A4AA
E1New HanoverE1Wake Forest
ME8Northern DurhamME8Panther Creek
E5DH ConleyE5Laney
ME4Cardinal GibbonsME4Fuquay-Varina
E3West JohnstonE3Heritage
ME6Pine ForestME6Holly Springs
E7ClaytonE7Leesville Road
ME2Cape FearME2Pinecrest
ME1ScotlandME1Middle Creek
E8New BernE8Wakefield
ME5Seventy-FirstME5South View
E4Southeast RaleighE4Sanderson
ME3HillsideME3Richmond
E6HoggardE6Millbrook
ME7PersonME7Green Hope
E2JH RoseE2Garner
W1DavieW1Lake Norman
MW8Southeast GuilfordMW8East Mecklenburg
W5AL BrownW5South Mecklenburg
MW4GlennMW4West Forsyth
W3WataugaW3West Mecklenburg
MW6Southwest GuilfordMW6Mooresville
W7Alexander CentralW7Olympic
MW2DudleyMW2Page
MW1East ForsythMW1Butler
W8HardingW8McDowell
MW5North DavidsonMW5Mallard Creek
W4TC RobersonW4Hough
MW3Mount TaborMW3Vance
W6Porter RidgeW6Ardrey Kell
MW7ParklandMW7Northwest Guilford
W2Charlotte CatholicW2Myers Park
3A3AA
E1West CravenE1West Brunswick
ME8Northeast GuilfordME8Northern Guilford
E5Nash CentralE5Jacksonville
ME4Eastern AlamanceME4Westover
E3HavelockE3Terry Sanford
ME6Walter M. WilliamsME6Northwood
E7FikeE7Topsail
ME2OrangeME2Lee County
ME1Southern NashME1Eastern Guilford
E8Northern NashE8Corinth Holders
ME5Southern LeeME5Asheboro
E4Rocky MountE4Triton
ME3Southern GuilfordME3Western Alamance
E6West CarteretE6Southern Durham
ME7South JohnstonME7Union Pines
E2Eastern WayneE2Cleveland
W1HibritenW1AC Reynolds
MW8McMichaelMW8Central Cabarrus
W5BurnsW5Erwin
MW4North ForsythMW4Sun Valley
W3CrestW3Kings Mountain
MW6East RowanMW6Ledford
W7FreedomW7Statesville
MW2West RowanMW2Weddington
MW1South PointMW1Robinson
W8West HendersonW8Ashbrook
MW5AnsonMW5Concord
W4TuscolaW4Marvin Ridge
MW3ForestviewMW3Hickory Ridge
W6PattonW6Asheville
MW7CarsonMW7Cuthbertson
W2PisgahW2South Iredell
2A2AA
E1NortheasternE1East Duplin
ME8MidwayME8Graham
E5Southwest OnslowE5Roanoke Rapids
ME4North JohnstonME4East Davidson
E3Edenton HolmesE3Hertford
ME6BeddingfieldME6Franklinton
E7KinstonE7North Brunswick
ME2Greene CentralME2TW Andrews
ME1South ColumbusME1Clinton
E8BertieE8North Lenoir
ME5FairmontME5South Granville
E4First FlightE4SouthWest Edgecombe
ME3East BladenME3Randleman
E6Farmville CentralE6Northside-Jacksonville
ME7Red SpringsME7St. Pauls
E2Ayden-GriftonE2Bunn
W1LincolntonW1Shelby
MW8ThomasvilleMW8North Surry
W5West WilkesW5Franklin
MW4Eastern RandolphMW4Cramer
W3HendersonvilleW3Huss
MW6LexingtonMW6Parkwood
W7PolkW7RS Central
MW2Surry CentralMW2Wilkes Central
MW1ReidsvilleMW1Monroe
W8MadisonW8West Lincoln
MW5West StanlyMW5Mount Pleasant
W4Mountain HeritageW4Maiden
MW3North RowanMW3East Lincoln
W6North WilkesW6Smoky Mountain
MW7CarverMW7West Stokes
W2BrevardW2West Caldwell
1A1AA
E1PlymouthE1East Carteret
ME8WeldonME8Rosewood
E5ManteoE5Gates County
ME4JonesME4Louisburg
E3Northside-PinetownE3Tarboro
ME6Rocky Mount PrepME6James Kenan
E7ColumbiaE7Camden
ME2North EdgecombeME2Granville Central
ME1Southeast HalifaxME1Lakewood
E8PamlicoE8Spring Creek
ME5NorthamptonME5Princeton
E4PerquimansE4Riverside
ME3KIPP PrideME3Union
E6MattamuskeetE6Heide Trask
ME7South CreekME7Pender
E2SouthsideE2Wallace Rose Hill
W1MurphyW1Mount Airy
MW8South RobesonMW8South Stanly
W5RobbinsvilleW5Pine Lake Prep
MW4Winston-Salem PrepMW4East Surry
W3Thomas JeffersonW3Bessemer City
MW6Bishop McGuinnessMW6North Moore
W7AndrewsW7Cherryville
MW2Mountain IslandMW2Whiteville
MW1North DuplinMW1West Montgomery
W8RosmanW8Starmount
MW5Union AcademyMW5North Stanly
W4CherokeeW4Swain
MW3AlleghanyMW3East Montgomery
W6HayesvilleW6Avery
MW7Chatham CentralMW7Walkertown
W2MitchellW2East Wilkes


Wednesday, November 2, 2016

Week 12 Top 15

8:14 PM
Week 12 Top 15


Carolina Gridiron ranks the top fifteen teams in each classification weekly during the football regular season. Teams are ranked based on a number of factors including strength of schedule, wins, and quality losses. Interact with us on Twitter (@NCGridiron and @NCGridironNews) and let us know your thoughts using the hashtag #CGTop15.

Wednesday, October 26, 2016

Week 11 Top 15

11:54 PM
Week 11 Top 15


Carolina Gridiron ranks the top fifteen teams in each classification weekly during the football regular season. Teams are ranked based on a number of factors including strength of schedule, wins, and quality losses. Interact with us on Twitter (@NCGridiron and @NCGridironNews) and let us know your thoughts using the hashtag #CGTop15.

Wednesday, October 19, 2016

Week 10 Top 15

10:54 PM
Week 10 Top 15


Carolina Gridiron ranks the top fifteen teams in each classification weekly during the football regular season. Teams are ranked based on a number of factors including strength of schedule, wins, and quality losses. Interact with us on Twitter (@NCGridiron and @NCGridironNews) and let us know your thoughts using the hashtag #CGTop15.

Thursday, October 13, 2016

Week 9 Top 15

10:09 PM
Week 9 Top 15


Carolina Gridiron ranks the top fifteen teams in each classification weekly during the football regular season. Teams are ranked based on a number of factors including strength of schedule, wins, and quality losses. Interact with us on Twitter (@NCGridiron and @NCGridironNews) and let us know your thoughts using the hashtag #CGTop15.

Wednesday, October 5, 2016

Week 8 Top 15

11:48 PM
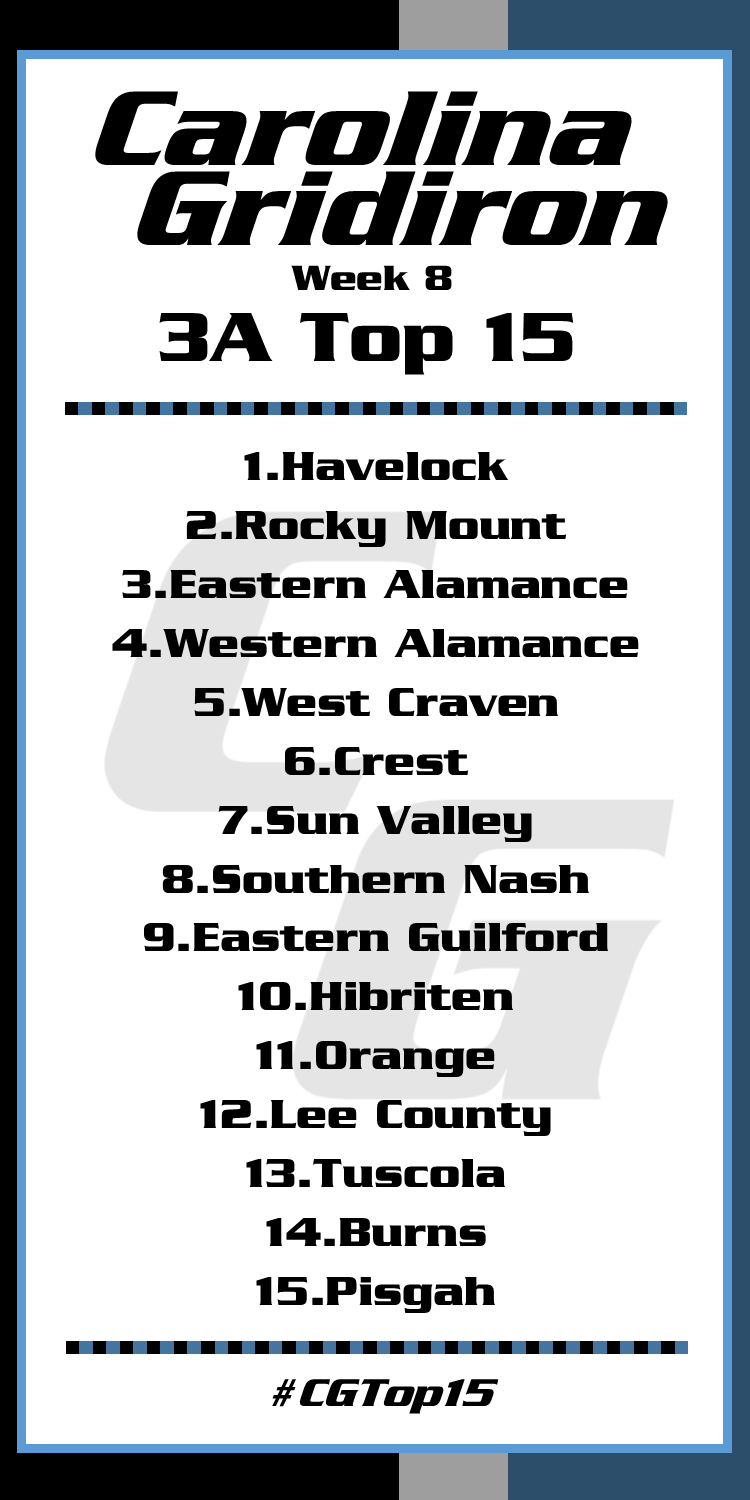
Week 8 Top 15


Carolina Gridiron ranks the top fifteen teams in each classification weekly during the football regular season. Teams are ranked based on a number of factors including strength of schedule, wins, and quality losses. Interact with us on Twitter (@NCGridiron and @NCGridironNews) and let us know your thoughts using the hashtag #CGTop15.

Wednesday, September 28, 2016

Week 7 Top 15

7:53 PM
Week 7 Top 15


Carolina Gridiron ranks the top fifteen teams in each classification weekly during the football regular season. Teams are ranked based on a number of factors including strength of schedule, wins, and quality losses. Interact with us on Twitter (@NCGridiron and @NCGridironNews) and let us know your thoughts using the hashtag #CGTop15.

Wednesday, September 21, 2016

Week 6 Top 15

8:12 PM
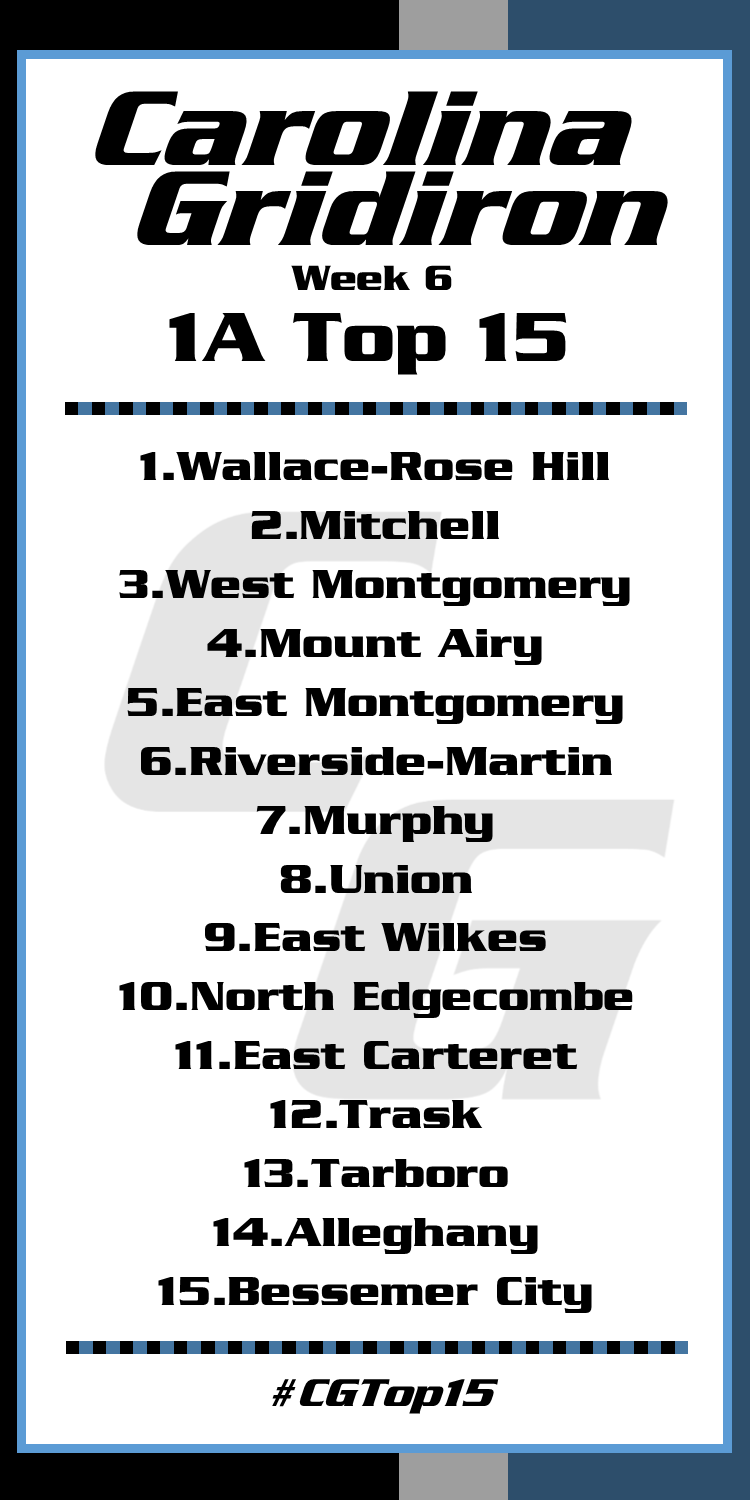
Week 6 Top 15


Carolina Gridiron ranks the top fifteen teams in each classification weekly during the football regular season. Teams are ranked based on a number of factors including strength of schedule, wins, and quality losses. Interact with us on Twitter (@NCGridiron and @NCGridironNews) and let us know your thoughts using the hashtag #CGTop15.

Wednesday, September 14, 2016

Week 5 Top 15

8:25 PM
Week 5 Top 15


Carolina Gridiron ranks the top fifteen teams in each classification weekly during the football regular season. Teams are ranked based on a number of factors including strength of schedule, wins, and quality losses. Interact with us on Twitter (@NCGridiron and @NCGridironNews) and let us know your thoughts using the hashtag #CGTop15.

Thursday, September 8, 2016

Week 4 Top 15

9:00 AM
Week 4 Top 15


Carolina Gridiron ranks the top fifteen teams in each classification weekly during the football regular season. Teams are ranked based on a number of factors including strength of schedule, wins, and quality losses. Interact with us on Twitter (@NCGridiron and @NCGridironNews) and let us know your thoughts using the hashtag #CGTop15.